What AltScreenerAI is, and what it measures
A candlestick reports four numbers per bar. ASA reports what sits behind them: the large orders waiting at each price, the levels where leveraged positions get forced out, and the walls, refreshed every 5 seconds. Free to use.
What you get
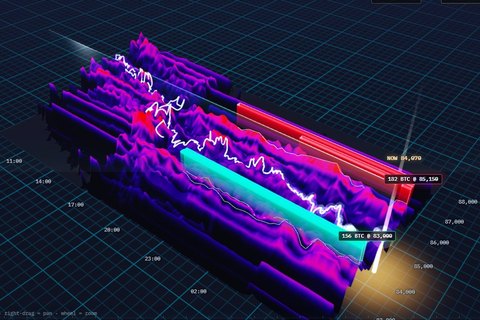
Resting heatmap
Bright bands are big waiting orders. Price can stall or turn there.
BTC resting orders, 2D and 3D, 12 hours to 7 days→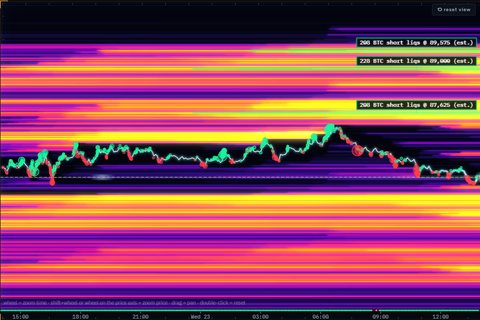
Liquidations
Where leveraged traders get forced out. Price can get pulled toward those zones.
5 models: 3 estimates, a consensus, the real liquidations→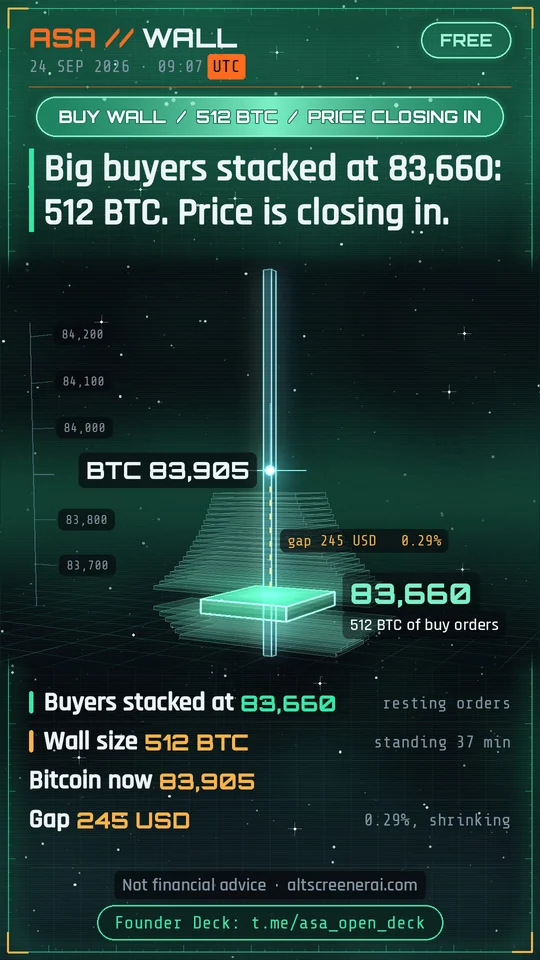
Signals and cards
When the signs line up, ASA sends one clear card. Chart, level, strength. No wall of text.
Checked every 30 seconds→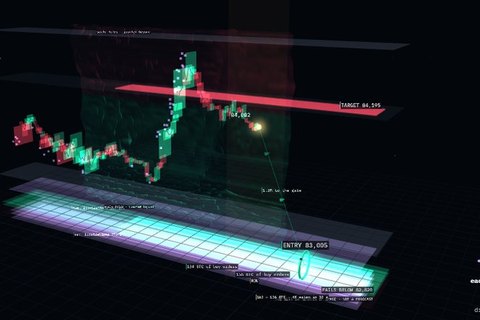
The Lab
Live 3D chart views on Bitcoin. What is resting, and what actually traded.
Candles, routes, walls, timeframes→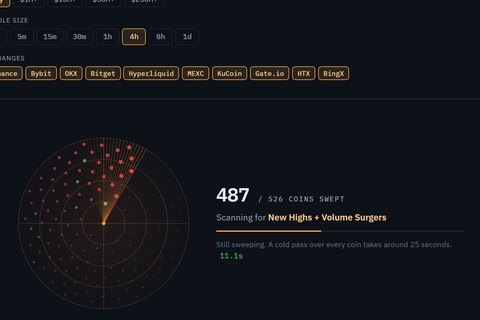
Radar
Scan 526 coins at once. Only the matches show up.
RSI, MACD, Bollinger, volume; 3m to 1d→How strong is an alert
Half the signs agree; the other half do not.
2 of 4 signs agreeThree signs agree, with the heavier resting size on one side.
3 of 4 signs agreeEverything points the same way. Moves can be fast.
4 of 4 signs, or a $300M+ buy/sell gapThe 4 signs: a big sell wall, a big buy wall, exchange flow, a weekly or monthly price level.
Tiers
Every tier, what it opens and what it costs are on one page: Pricing.
Questions
Do I need an account?
No. Open the site and use it. An account only saves your own scans and alerts.
Where does the data come from?
Public market data from major exchanges, captured around the clock.
Is this advice?
No. ASA shows what it measures. It does not predict, and it does not trade for anyone.